Motivation
Prior to the 2013-2014 NBA season, SportVu tracking cameras were installed in all 30 NBA arenas. These six cameras would use cutting edge technology to track the exact location of all players, ref and the ball 25 times a second. This tracking data could later be used by teams, the league and privately run companies to provide new insights and analysis about the game of basketball.
Although most of this data is heavily guarded, a small portion is available publicly on NBA.com. It is our hope to use this data, combining it with the previously available play-by-play and shot chart data, to create a model that will give us the probability that a given shot will go in. With this model we will explore many insights that could prove valuable to fans and teams alike.
Some prior work in this area has been done, and it was these projects which partially inspired us to do this. These projects are, in no particular order:
- John Ezekowitz et all. on The Hot Hand
- Yu-Han Chang et all. on Quantifying Shot Quality in the NBA
- Krishna Narsu with his KOBE model
Objectives
- Create a model that will give us a probability of each shot going in. The three main techniques we will pursue are:
- Logistic Regression with l1 (Lasso) Regularization
- Logistic Regression with l2 (Ridge) Regularization
- Random Forest
- Explore how shot difficulty and shooting percentage above expected vary with quarter and time left in the game
- Explore how shot difficulty and shooting percentage above expected vary with score differential.
- Quantify which players take the highest percentage shots and which players score the most above their projected output.
- Quantify which players increase their teammates' expected points per shot the most.
Data
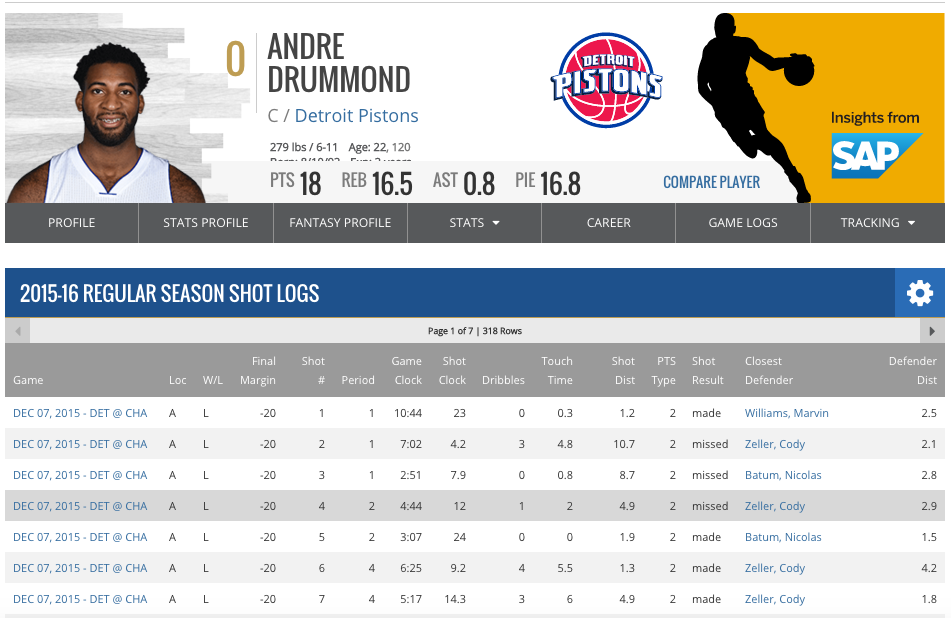
The first type of data that we want to get is the SportVu tracking data for all shots. These shots are sorted by player and are located on the 'Shot Log' page of their player profile.
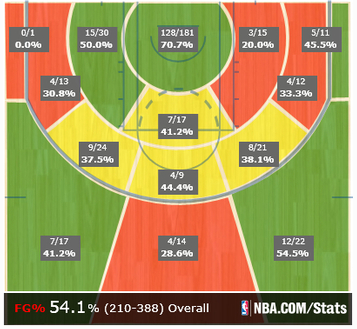
The next type of data that we need is the data from the NBA.com shot charts. This provides us with new information like the type of shot, general area (Right, Left, Middle) of each shot, and x,y coordinates.
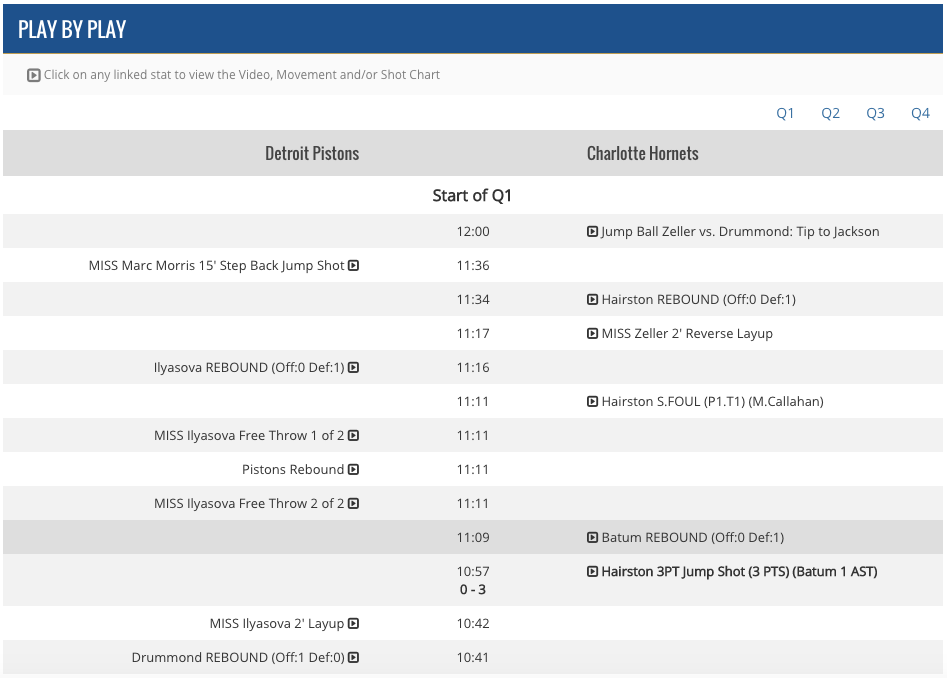
Finally, we have out last set of data, play by play for each game. This dataset will provide us with other key pieces of information we need for our insights that we don't already have, like score differential at time of shot, whether the action before was a turnover (to identify fast break opportunities) and the ids of the players who are on the court.
Model
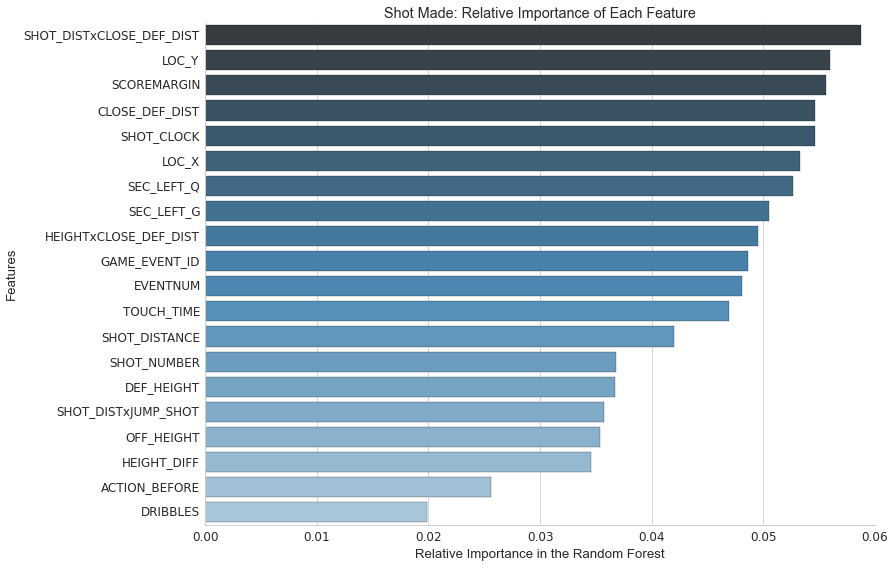
We built several models with the data, experimenting with logistic regression with l1 and l2 penalties, the best of which predicts with 65% accuracy whether a given shot will go on, significantly better than any publicly available model available thus far. This model allows us to see how different players perform compared to an average player taking that shot. This model takes into account the distance from the basket, the distance from the nearest defender, the type of shot, the amount time the player held onto the ball before the shot, and a couple other key variables that were captured by the NBA play by play cameras. Below is a chart of the key variables as sorted by feature importance from the random forest model that we built.
Analysis
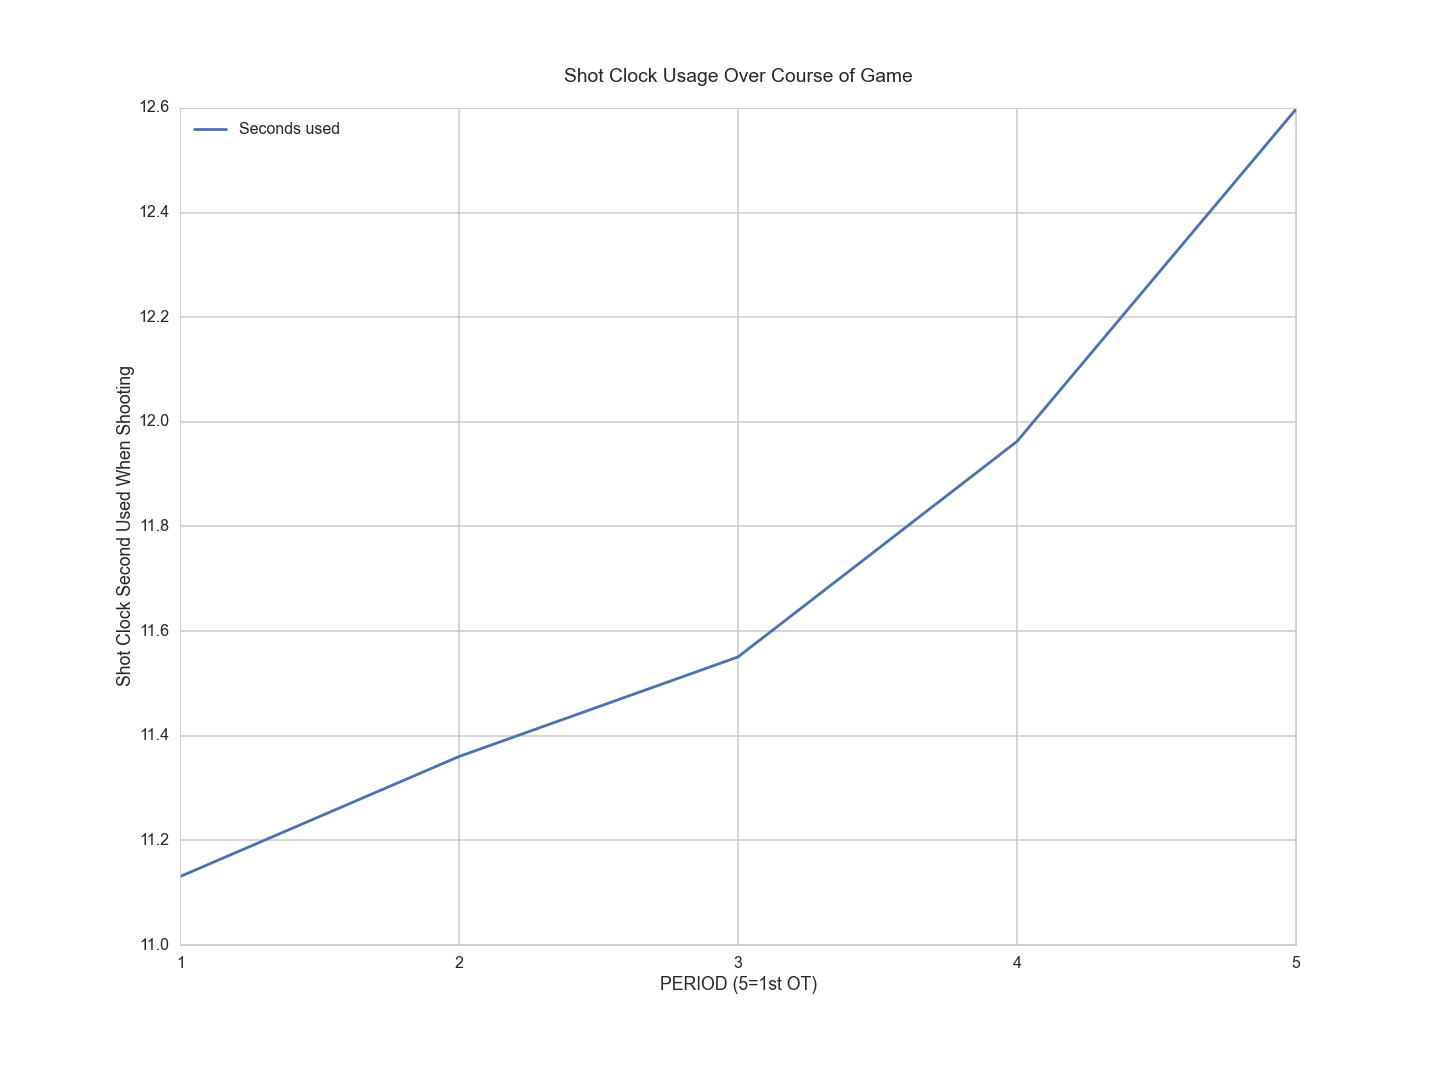
In the NBA, teams are allotted 24 seconds to shoot. The graph below shows that on average, teams use up more of the 24 seconds as the game progresses. The cause is unclear, but one can hypothesize that two factors combine to create this effect. First, teams take longer to find a good shot as the game progresses because teams are adjusting to their opponents strategies as the game progresses. Second, teams struggle to find good shots as the game progresses because they get tired.
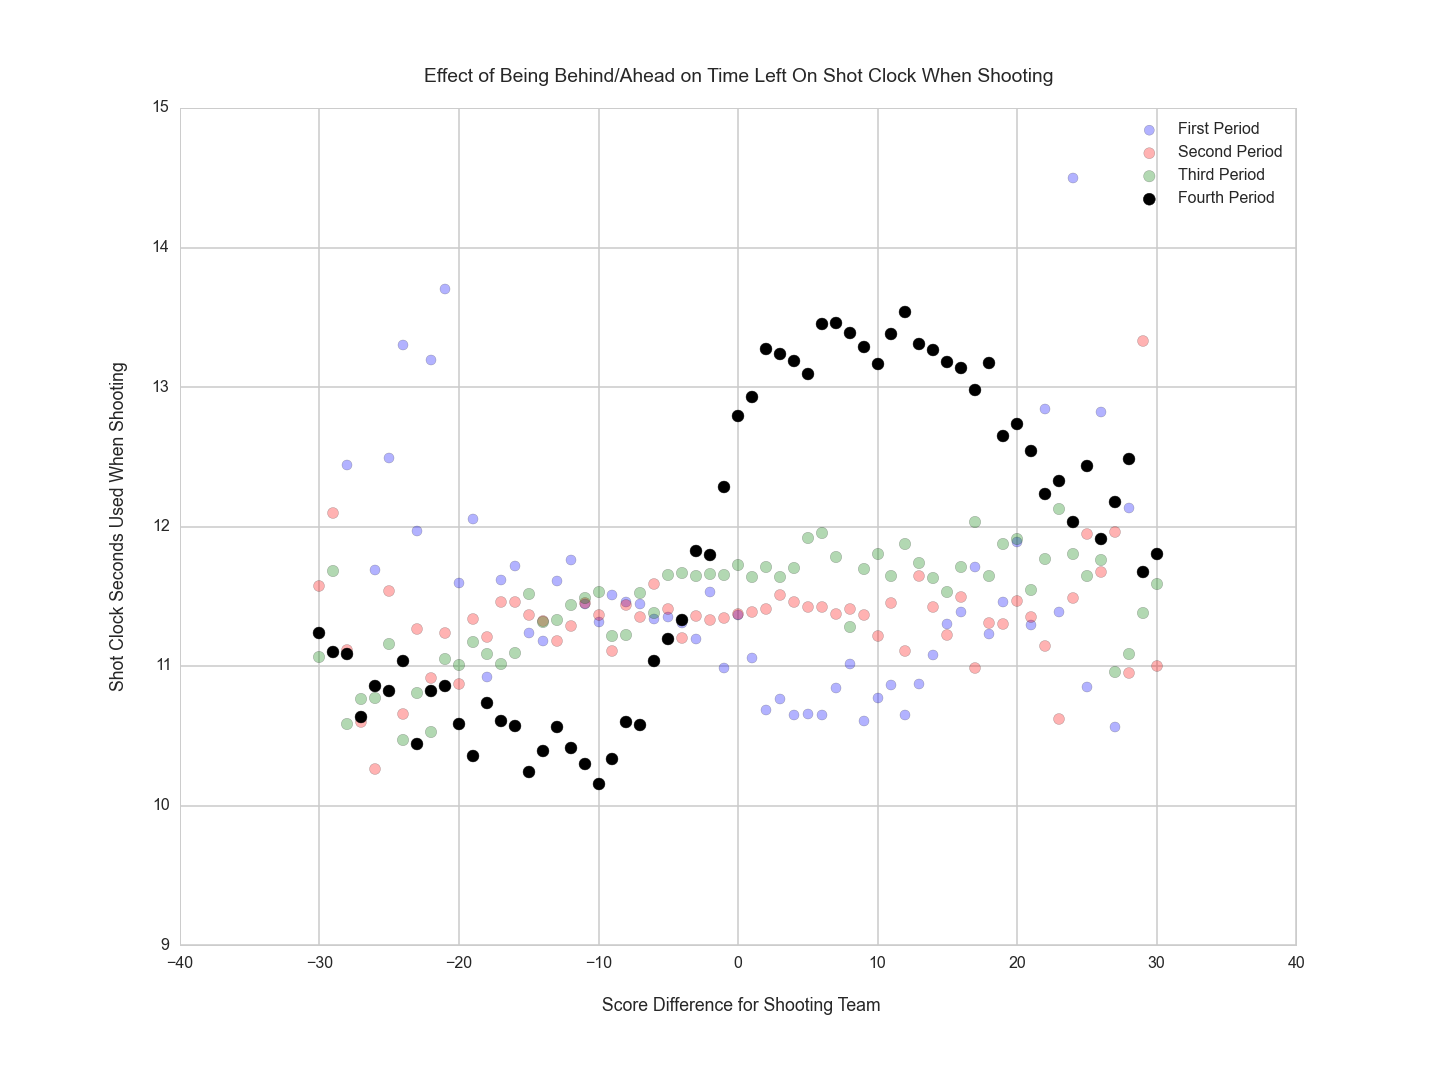
In order to understand what factors might cause a team to take longer to shoot every quarter, we broke down the time by quarter and by the current score differential for the shooting team. We hypothesized that teams in the lead might try to kill time and teams falling behind might try to shoot more quickly. This effect reveals itself in the visualization, but only for data from the fourth quarter. This makes sense however, because teams feel more time pressure in the fourth quarter than any other.
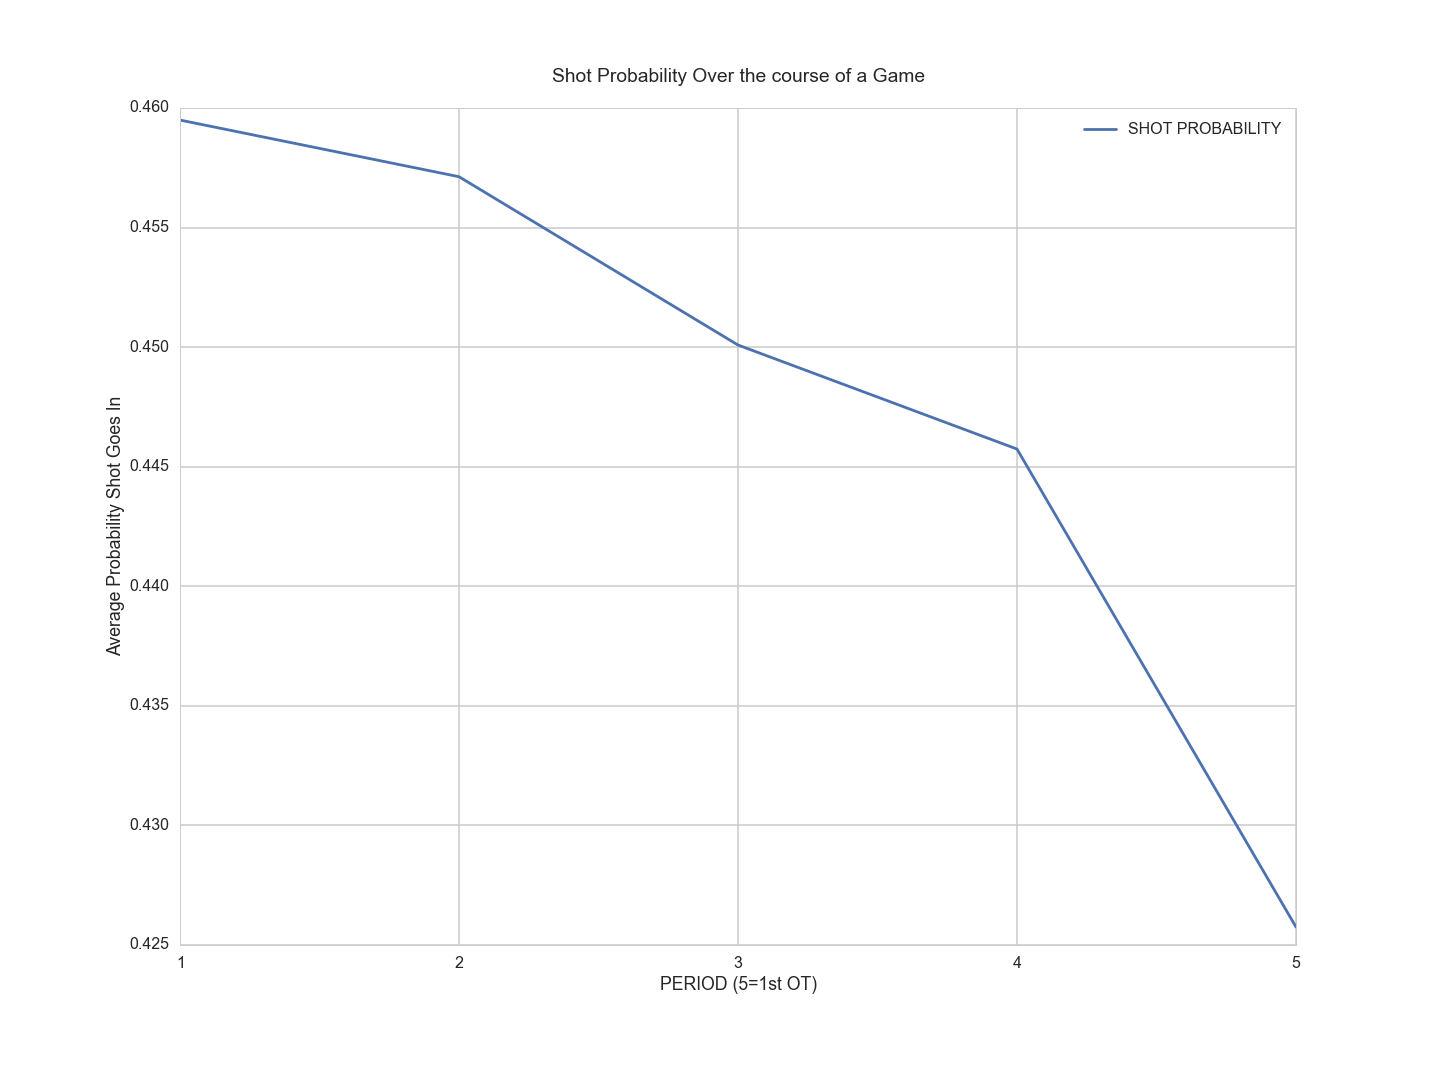
This next graph shows that the average probability of a shot going in decreases by quarter, likely for the same reasons teams take longer to shoot as the game progresses: fatigue and adjusted strategies.
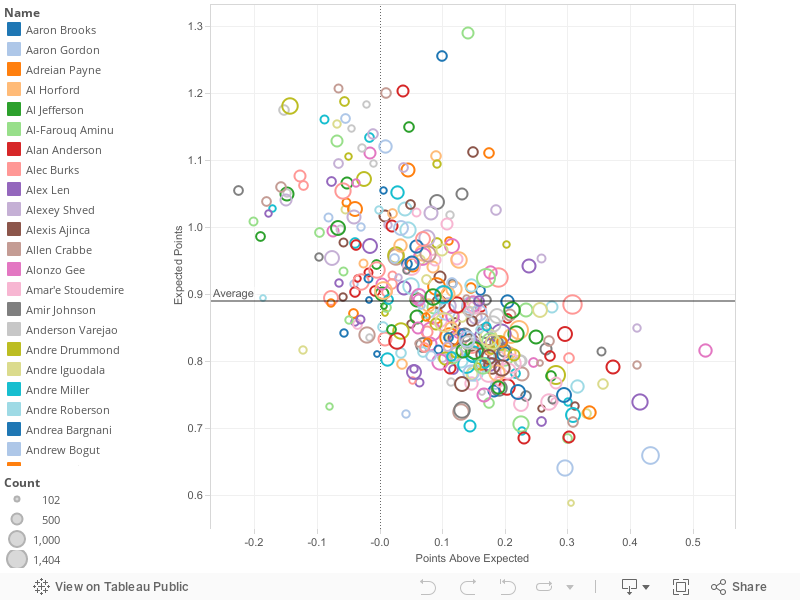
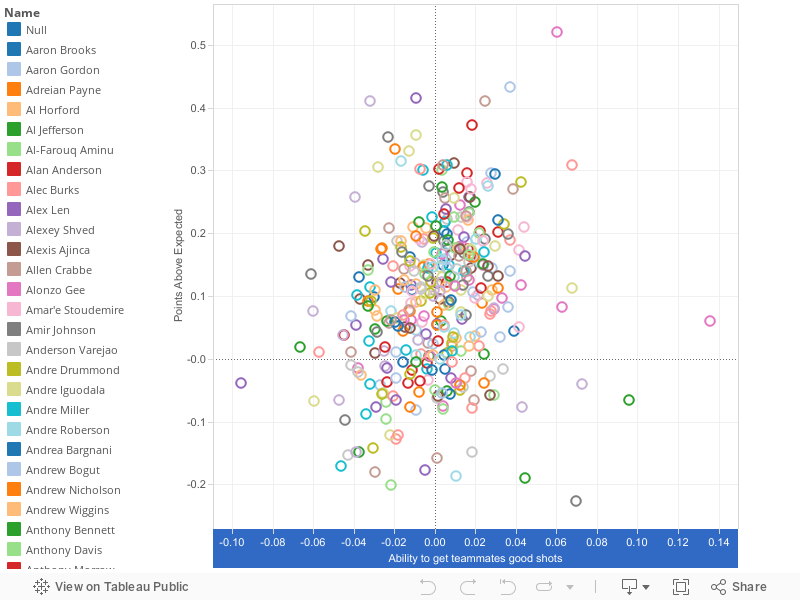
Two different components go into all points scored. First is the expected points per shot, and then there points scored above/below average. For example, if our model says Steph Curry has a 40% chance of scoring a given three pointer, then his expected points on that shot is 1.2. If he makes the shot then his points above expected on that shot is 1.8, if he misses it then it is -1.2. We can average these components for all of a player's shots to get there average expected points and average points above expectation. We found those components for all players, and then plotted them on a graph. Going clockwise, the upper right quadrant is players who take easy shots and make them at a higher than expected rate, the bottom right is players that take hard shots and make them at a higher than expected rate, the bottom left is players who take tough shots and don't make them a lot, and then the upper left is players who take easy shots and don't make them a lot.
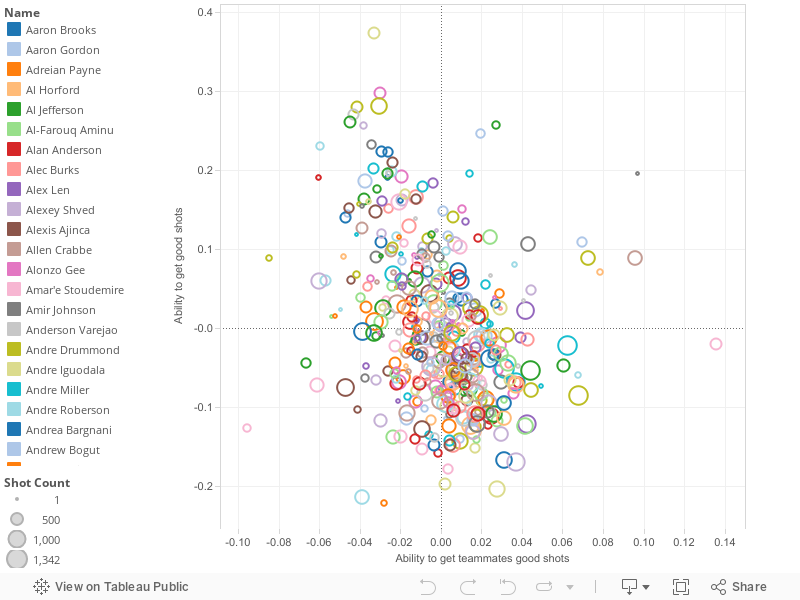
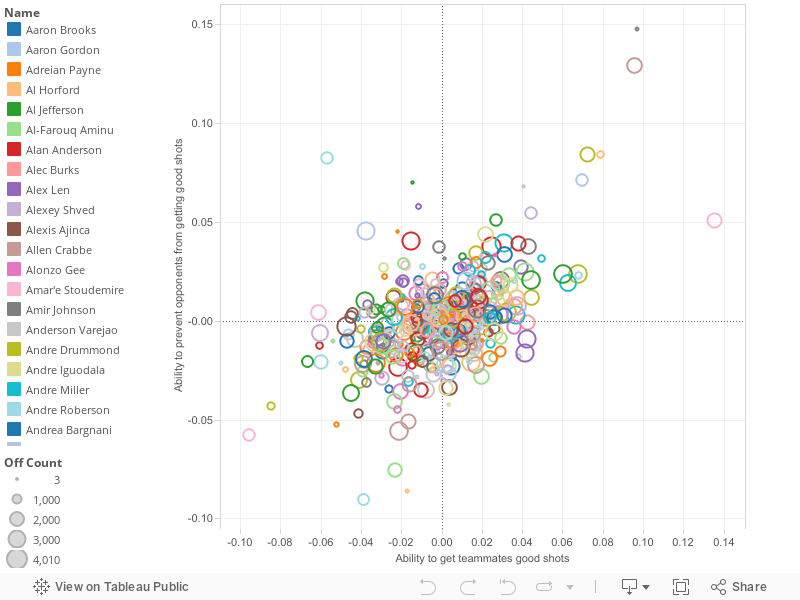
Of course, a player's expected points per shot is in turn affected by multiple things. There is the ability of the player himself to get good looks, there is the ability of his teammates to get him good looks, and then there is the ability of the defense to stop him from getting good looks. Running a massive ridge regression with the expected points for a shot as the dependent variable and then dummy variables for who is on the court (three possible types: one for the shooter, one for each player on offense but not shooting, and then one for each player on defense), we can get three coefficients for each player: their ability to get good shoots, their ability to help their teammates get good shots, and their ability to prevent opponents from getting good shots. Below we have plotted scatterplots reflecting a few of those stats.
Ability to get good shots vs. Ability to get teammates good shots
Ability to get teammates good shots vs. Ability to prevent opponents from getting good shots
Ability to get teammates good shots vs. Points Above Expected
Contact
Please feel free to contact us with any questions/comments!